The HIVE Real-Time Dashboard provides a variety of useful statistics for network managers & others responsible for the broadcast:
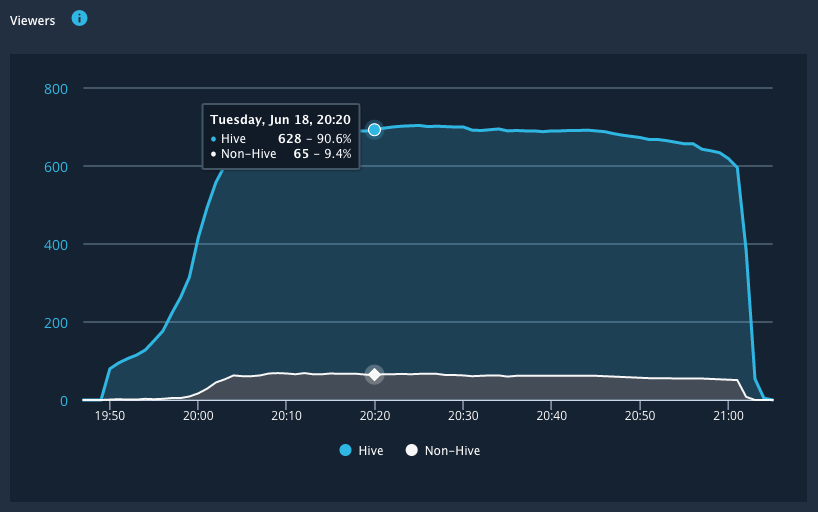
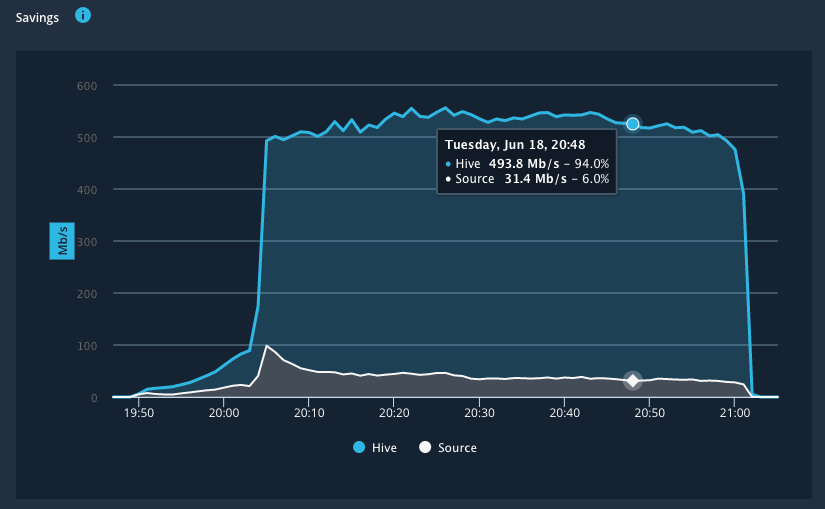
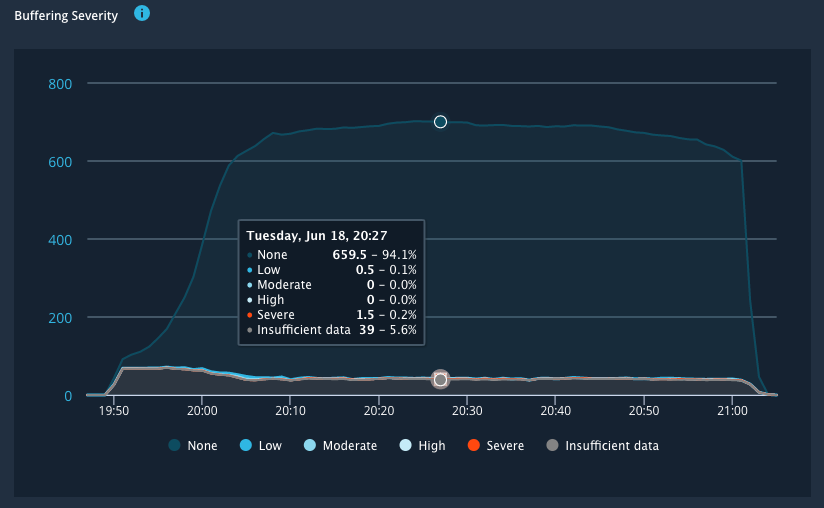
The HIVE Real-Time Dashboard includes the following graphs:
Viewers: The number of unique viewers watching the event over time, divided in viewers using HIVE distribution and viewers not using HIVE.
Savings: The amount and percentage of data transfer saved by using the Hive Client compared to a conventional setup. NOTE: Hive Insights Only customers will not see savings reported because their service is limited to statistics only.
Buffering Severity. The number and duration of buffering experienced by the viewer per 30-second snapshot. Note that viewers have an initial expected buffering when starting a video.
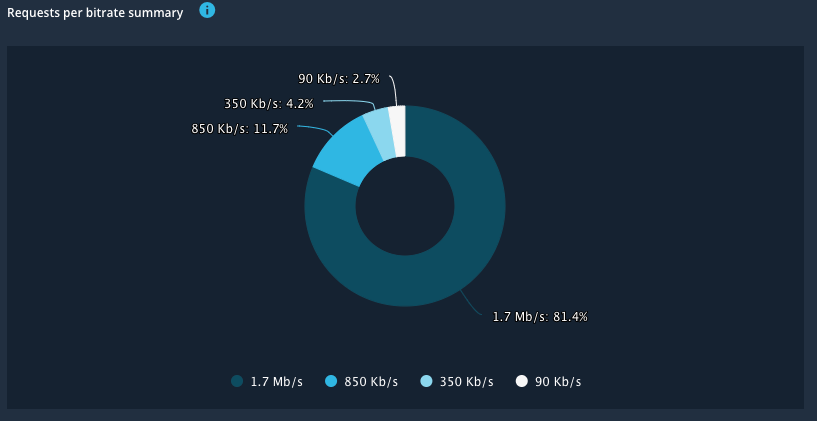
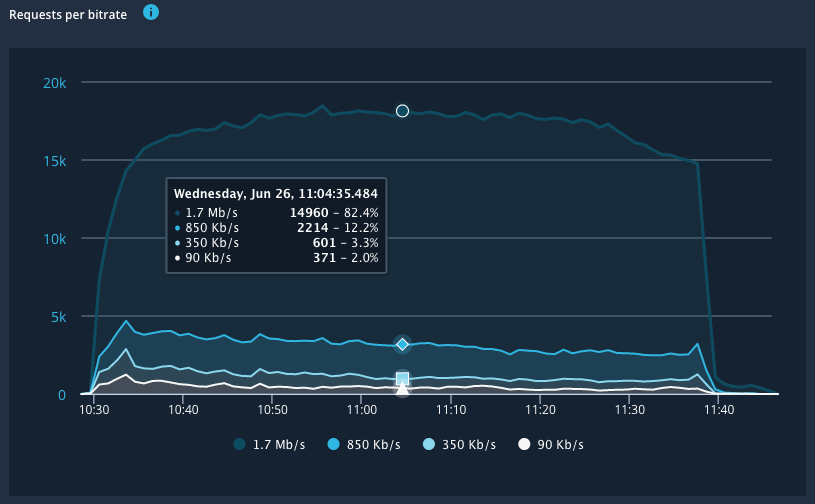
Requests per bitrate summary: the amount of viewers streaming at each video bitrate.
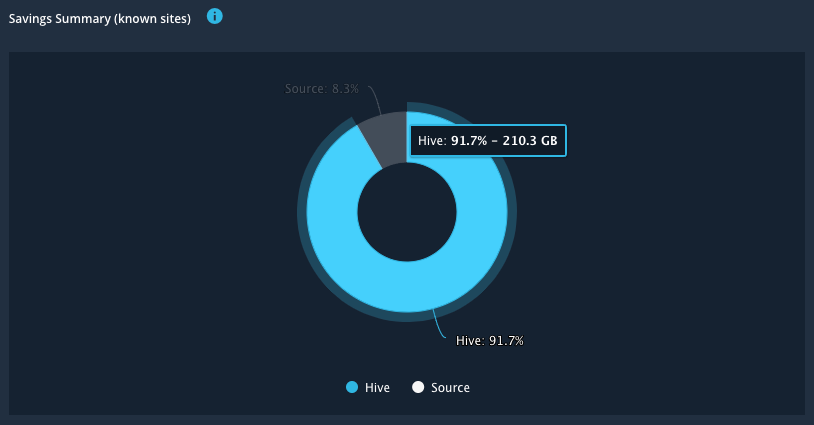
Savings Summary: the amount and percentage of data transfer saved by using the Hive Client compared to a conventional streaming setup. NOTE: Hive Insights Only customers will not see savings reported because their service is limited to statistics only.
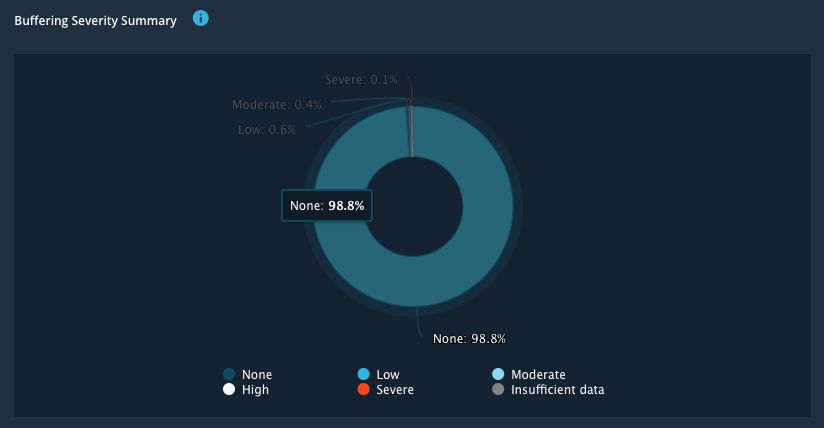
Buffering Severity Summary: Summary of all buffering, calculated per 30-second snapshot.
Requests per bitrate: the distribution of unique Agents streaming at a given bitrate over time.
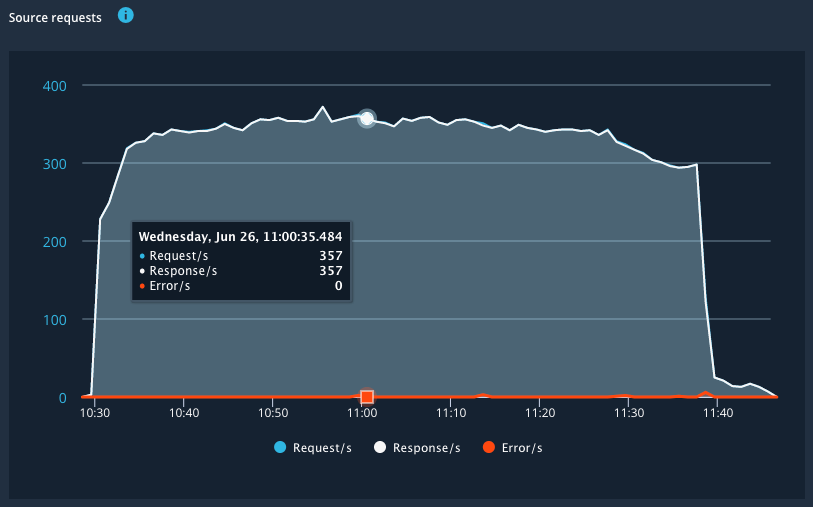
Source requests: the amount of requests per second made against the CDN (Content Delivery Network) or video source to download the original video content.
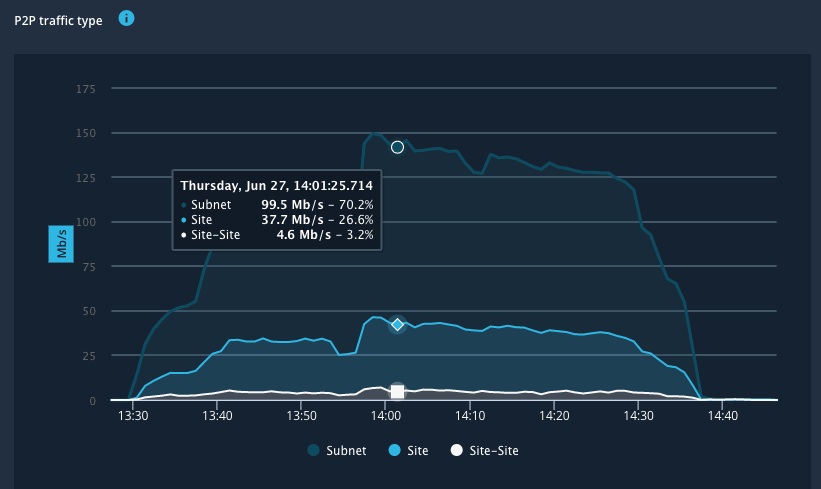
P2P traffic type: the distribution of Hive Clients’ P2P traffic types over time. Keeping the traffic local will reduce stress on the enterprise network. Subnet traffic is preferred, followed by Site and Site-to-Site.
Click on the HIVE Insights link in the upper-right corner of the page to load the related HIVE Insights report.

