The HIVE Real-Time DashboardLive Monitor provides a variety of useful statistics for network managers & others responsible for the webcast:
The HIVE Real-Time Dashboard includes the following graphs:
...
.
You can also click there on the HIVE Insights link in the upper-right corner of the page to load the related HIVE Insights report.
...
The video data is expressed in a set of 9 graphs. Below you'll find a description for each graph.
Graph name | Description | Example image | Result format |
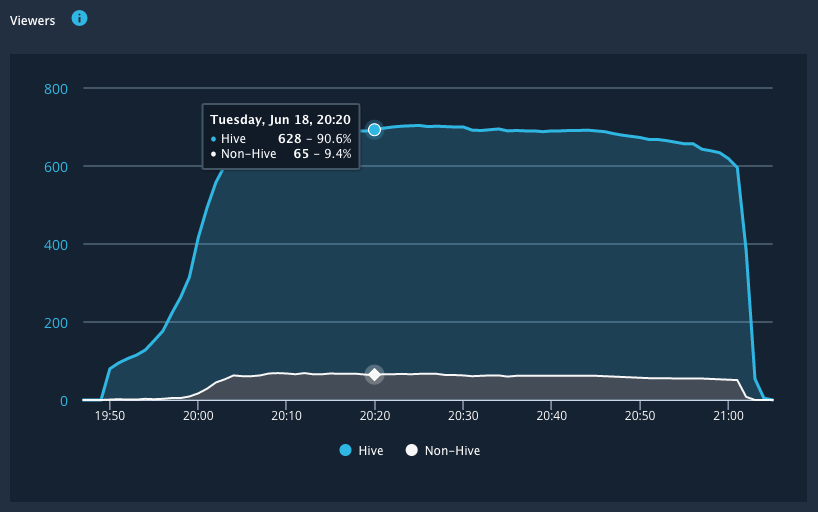
Viewers | The number of unique viewers watching the video event over time, divided in Hive agent viewers |
...
and viewers not |
...
running the Hive agent. |
Savings: The amount and percentage of data transfer saved by using the Hive Client compared to a conventional setup. NOTE: Hive Insights Only customers will not see savings reported because their service is limited to statistics only.
...
...
Results are shown in a graph with Time on the X-axis and Viewers on the Y-axis. Hover over the graphic to see the exact number of viewers at a specific time. | |||
Traffic | Shows how much traffic was handled by Hive distribution and that handled by the “Source”. Hover over a point on the graph for more information: Hive: The traffic handled by Hive distribution (All sites). Source: The traffic that was not handled by Hive distribution. | Results are shown in a graph with Time on the X-axis and Traffic (in Mb/s) on the Y-axis, for Hive traffic and Source traffic. Hover over the graphic to see the exact percentage of Hive and Source traffic. | |
Buffering Severity | The number and lengths of viewer buffering per 30 seconds snapshots. Note that viewers have an initial expected buffering when starting a video. |
...
Requests per bitrate summary: the amount of viewers streaming at each video bitrate.
...
Savings Summary: the amount and percentage of data transfer saved by using the Hive Client compared to a conventional streaming setup. NOTE: Hive Insights Only customers will not see savings reported because their service is limited to statistics only.
...
...
Results are shown in a graph per buffering severity with Time on the X-axis and Viewers on the Y-axis. Hover over the graphic to see the exact number of buffering severity of a specific time. | |||
Request per bitrate | The percentage of unique viewers watching the video on a specific bitrate. | The results are shown in the pie chart with a percentage. Hover over the chart to see the bitrate summary per group. Possible groups: All the different bitrates used during a video event. | |
Savings | How much data traffic was handled by Hive distribution Vs. what was streamed directly from the CDN by Hive enabled viewers, IE: How much network traffic data was saved by using Hive. Hover over a graph segment for more details. There are 2 different modes available (Use the toggle switch to change between them): Known sites - This mode displays data from sites which the customer has specified information for. All sites - This displays data from all sites. Both modes use only traffic generated using Hive distribution. | The results are shown in the pie chart with a percentage. Hover over the chart to see the savings per group in GB. Possible groups:
| |
Buffering Severity Summary | Summary of all buffering, calculated per 30 |
...
seconds snapshot. | The results are shown in a pie chart with a percentage. Hover over the chart to see the buffering severity per group. Possible groups:
| |
Requests per bitrate |
...
...
over time | The distribution of the bitrates requests over time. | Results are shown in a graph per bitrate with Time on the X-axis and Viewers on the Y-axis. Hover over the graphic to see the exact number of bitrate at a specific time. | |
Source requests | The type of data downloaded from the CDN (Content Delivery Network) |
...
...
over time. | Results are shown in a graph per data type with Time on the X-axis and Number of data type calls on the Y-axis. Hover over the graphic to see the exact number of requests per type at a specific time. Possible groups:
| |
P2P traffic type | The distribution of P2P traffic in Mb/s over time. Keeping the Hive traffic local will reduce stress on the enterprise network. |
...
From better to worse, the traffic types are: Subnet, Site, Site-Site. |
...
Results are shown in a graph per data type with Time on the X-axis and Traffic (in Mb/s) on the Y-axis. Hover over the graphic to see the exact number of traffic at a specific time. Possible groups:
|


